Prevent PostgreSQL incidents.Take control back.
Azimutt Inspector combines expert heuristics and AI to surface risks early, detecting query/schema issues with actionable & pedagogical suggestions.
Deploy fully on‑prem or VPC‑only with least‑privilege access.
The State of PostgreSQL Management Today
Managing complex PostgreSQL databases presents significant challenges for modern teams, particularly as data footprints grow exponentially.
Constant Fire-Fighting
One unindexed query, a long transaction, or a misconfigured autovacuum can saturate Postgres. Teams spend time reacting instead of preventing.
Slow Incident Resolution
Root cause is buried: plan changes, lock chains, bloat, or IO saturation. Without context, MTTR stretches from minutes to hours or even days.
Alert Fatigue
Generic metrics alert too often, or not at all, and lack query‑level context. Noisy dashboards get ignored; real issues slip through.
Knowledge Gap
Hard‑won PostgreSQL expertise (plans, VACUUM, WAL, hotspots) is scarce and brittle. Teams need built‑in best practices.
Typical Database Management Issues
- 1Reactive instead of proactive approach
- 2Performance degradation discovered too late
- 3Missing context (plans/stats/settings/history) during incidents
- 4No early warning on autovacuum, bloat, long transactions, replication lag
- 5Generic infra metrics without PostgreSQL‑specific heuristics
The Azimutt Approach
Inspector combines expert rules with AI to evaluate catalogs and pg_stat_* data, highlighting risks early and proposing safe, step‑by‑step remediations before they impact your business.
Built for serious PostgreSQL operations
Azimutt Inspector combines community knowledge with clients experience to build the first database analysis platform integrating AI with deep expertise.
PostgreSQL leads with deep integration and curated rules.
More databases are coming; custom rules for MySQL are already available.
Early risk detection
Detect bloat, lock chains, long transactions, replication lag, autovacuum misconfig, and plan regressions before they wake you up.
Noise‑free alerts & suggestions
Built with individual algorithms instead of global thresholds. Deduplicated and scored alerts with context (query, plan, table).
Comprehensive Postgres analysis
Correlate catalogs with pg_stat_* and pg_stat_statements. Track plan changes over time and spot anti‑patterns automatically.
Performance optimization
Identify high‑cost queries, missing/unused indexes, skewed cardinalities, and provide concrete index and query rewrite candidates.
On‑prem / VPC‑only
Run fully on‑prem or inside your VPC. No outbound access required. Data stays in your network.
Security insights
Lint roles and permissions, public schema exposure, TLS config, long‑lived superusers, and unsafe settings with clear remediations.
Pluggable rules
Write your own collectors/analyzers/notifiers using TypeScript, raw SQL or AI prompt.
Integrated workflows
Plug into your stack: Prometheus/Grafana, Slack, PagerDuty, or use API/Webhooks for seamless integration.
How Azimutt Inspector Works
Our approach combines comprehensive analysis with actionable insights to transform how you manage PostgreSQL databases.
Connect & analyze
Connect with a least‑privilege read‑only role on system tables. Inspector reads catalogs, pg_stat_* views, and optional pg_stat_statements without affecting performance.
Identify issues & risks
Expert defined rules + AI to correlate signals and surface problems early (bloat, locks, plan regressions) with severity and confidence.
Generate smart suggestions
Each finding includes pedagogical explanation, context (query, plan, relations, indexes...), evaluation and safe remediation steps.
Implement & verify
Apply changes and verify impact via metrics and query stats. Close the loop with continuous checks and alert tuning.
Suggestions
Missing Index on Frequently Filtered Column
The column users.email is frequently used in WHERE clauses but has no index, causing full table scans.
Suggestion:
CREATE INDEX idx_users_email ON users(email);
Sub-optimal Query Pattern Detected
Multiple joins with LIKE operations are causing excessive CPU usage in the search_products query.
Suggestion:
Consider implementing a full-text search index to optimize text searching operations:
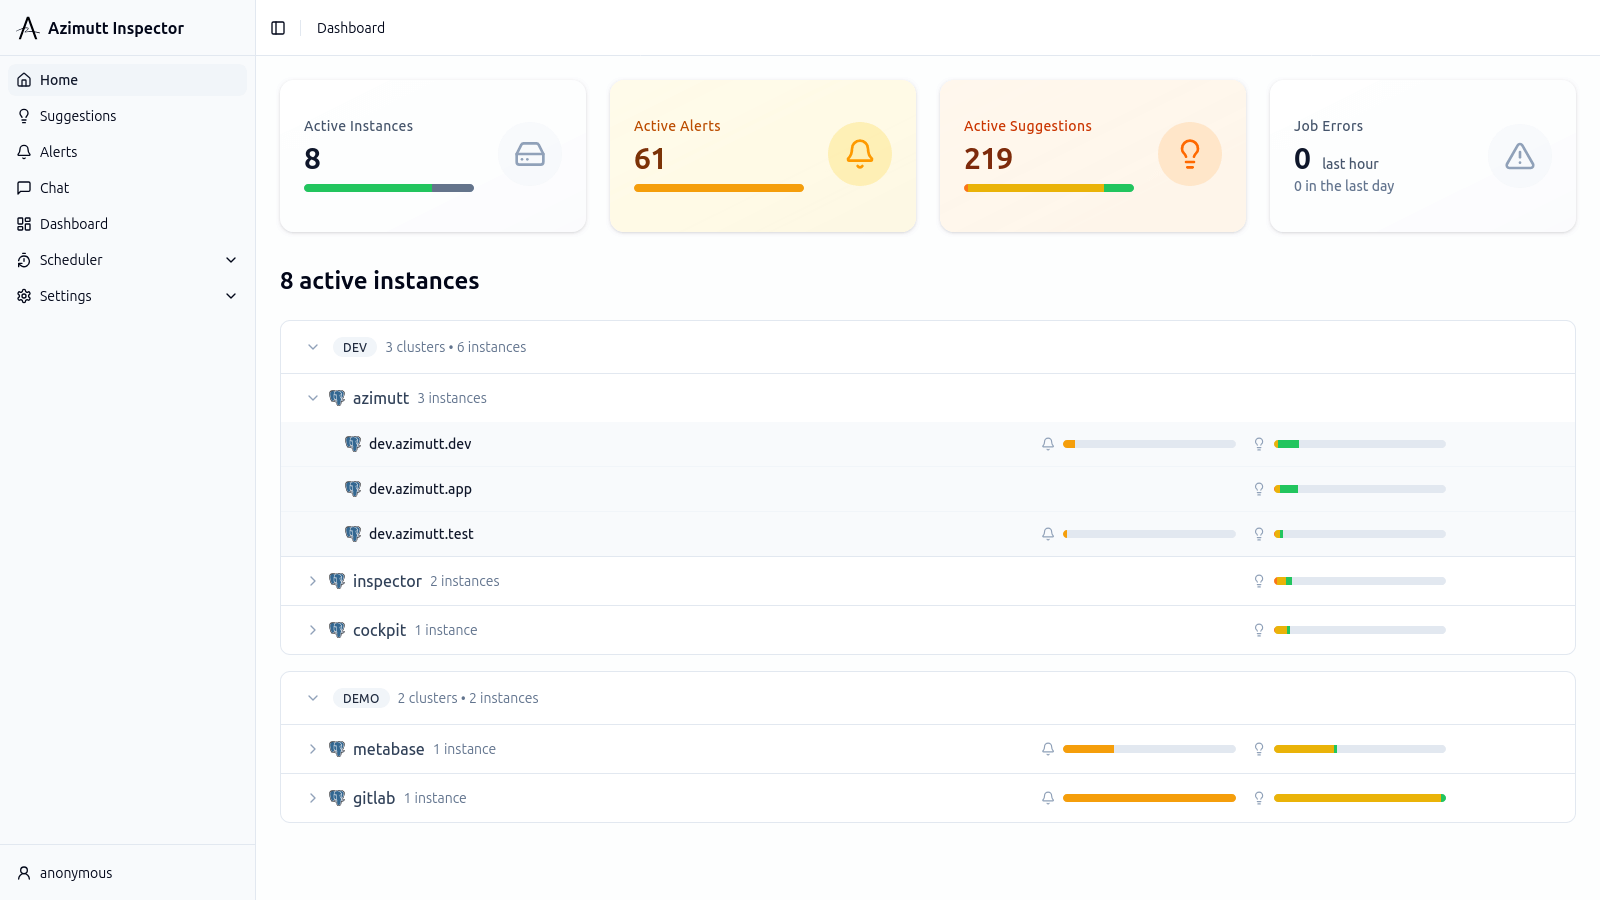
Suggestions Tailored to Your Database
Explore product screenshots and see how Inspector surfaces issues and opportunities before they impact production.
Tailored for Your Role
Azimutt Inspector provides value across teams, helping everyone contribute to a healthy database.
Database Administrators (DBAs)
Proactively manage Postgres at scale with less toil. Move from status dashboards to actionable, explainable findings.
- Continuous checks and prioritized suggestions
- Schema linting (FKeys, indexes, nullable, bloat)
- Resource utilization and capacity signals
- Advanced PostgreSQL deep (plans, stats, config)
Site Reliability Engineers (SREs)
Reduce pages and MTTR. Align database signals with your incident workflows and SLOs.
- Anomaly detection with severity and confidence
- Capacity planning and saturation indicators
- Incident prevention and runbook‑ready context
- Prometheus/Grafana, Slack, PagerDuty integrations
Database Reliability Engineers (DBREs)
Standardize best practices across teams. Bake rules into CI/CD and change review.
- Best practice enforcement with pluggable rules
- Security and compliance checks (roles, TLS, exposure)
- Change impact and plan regression analysis
- Risk assessment for schema and index changes
Developers
Ship features with confidence. Get query feedback early and clear guidance when things go wrong.
- Query performance hints and anti‑pattern detection
- Schema design guidance and safe migration tips
- Development best practices and sample fixes
- Early warnings mapped to PRs and deployments
Quick start for engineers
Spin up Azimutt Inspector safely in minutes. Use a least-privilege role. Keep traffic inside your network.
Create a read-only role on system tables
Inspector needs metadata and runtime stats. Use least-privilege access.
-- Create a least-privilege read-only role for Inspector
CREATE USER azimutt WITH PASSWORD 'strong-password';
GRANT CONNECT ON DATABASE your_database TO azimutt;
GRANT pg_monitor TO azimutt;
Adjust as needed. Works with RDS, Cloud SQL, Aurora, and bare-metal.
Run with Docker
Minimal footprint. No persistent data unless you add a volume. Require private access.
# Run Inspector locally with Docker (no data leaves your network)
docker run --rm -p 3000:3000 ghcr.io/azimuttapp/inspector:latestSecurity & privacy by design
Inspector is built for security-conscious teams. Run fully on-prem with fine-grained configuration.
On‑prem or VPC‑only
- Single binary or Docker image
- No outbound connectivity required
- Bring your own observability stack
Least privilege
- Read-only role with explicit grants
- Scope to selected schemas
- No access to application secrets
Data handling
- Metadata and statistics only by default
- PII-aware rules and redaction
- Configurable retention policies
FAQ
Answers for pragmatic engineers and DBAs
Does Inspector run in our network?
Yes. Inspector is designed to run fully on‑prem or inside your VPC. It can operate without outbound Internet access.
What permissions are required?
A least‑privilege read‑only role with SELECT on system tables. A sample SQL setup script is provided in the Quick Start.
Will it slow down our database?
No. Inspector uses lightweight sampling and system catalogs. Collection is read‑only and tuned to minimize overhead. You have full control over collection frequency.
How are alerts and suggestions generated?
We combine deterministic checks from PostgreSQL best practices, heuristics from production experience, and AI‑assisted analysis where appropriate.
Can we customize rules?
Yes. The rule engine is modular; you can enable/disable categories and add organization‑specific checks written as a TypeScript function.
Do you support databases other than PostgreSQL?
PostgreSQL is the first engine with extensive integration. Support for other databases is coming. You can already write your own rules for MySQL.
Ready to harden and accelerate PostgreSQL—on your infrastructure?
Move from reactive firefighting to proactive prevention with an on‑prem/VPC‑only deployment and least‑privilege access. See how it works on your data—safely.